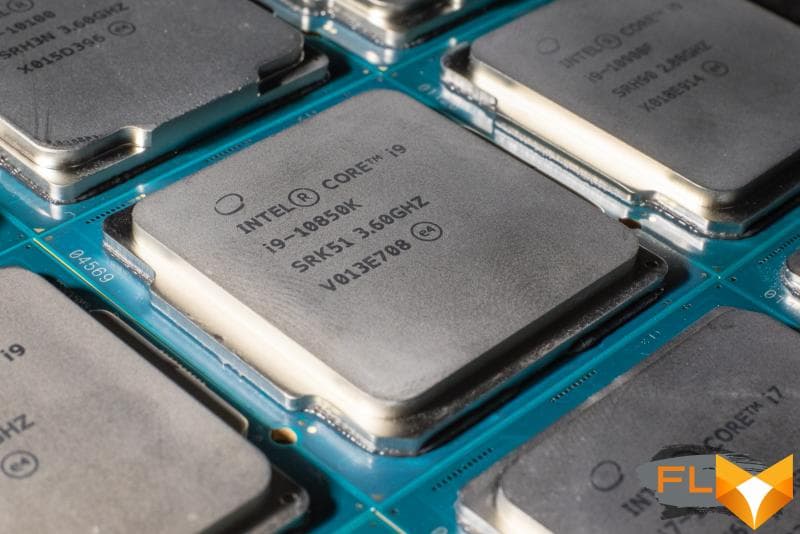


The model that came to us for review almost does not differ in specifications from the flagship Core i9-10900K processor, so it does not look like an addition or further development of the lineup, but rather like a veiled attempt to reduce the price of the flagship ten-core overclocker. Indeed, the official cost of the Core i9-10900K is $488, while the Core i9-10850K, which is only 100 MHz slower, is 7% cheaper at $453. But in reality, the price gap can turn out to be even more significant: if you focus on stores, then by choosing the Core i9-10850K instead of the flagship, you can save up to $ 100.
The fact that Intel estimated the insignificant 100 MHz at such a tangible amount involuntarily suggests that the Core i9-10850K was born (three months after the Core i9-10900K) not so much for some technological reasons, but for marketing reasons. At the very least, potential difficulties with the selection of ten-core chips capable of operating at frequencies up to 5.3 GHz are likely to play a far from primary role here. Intel itself says that the Core i9-10850K was created “by popular demand.” But the most likely version seems to be that by releasing such a version of the CPU, the company “customized” its price list to market realities, primarily to oppose something significant to the competitor’s popular 12-core processor, which consistently occupies a leading position in retail sales. Indeed, the Ryzen 9 3900X is significantly cheaper today than the Core i9-10900K, which certainly makes many choose it over Intel’s ten-core, even though the latter offers definitely better gaming performance. The new Core i9-10850K has a good chance to at least temporarily fix this skew.
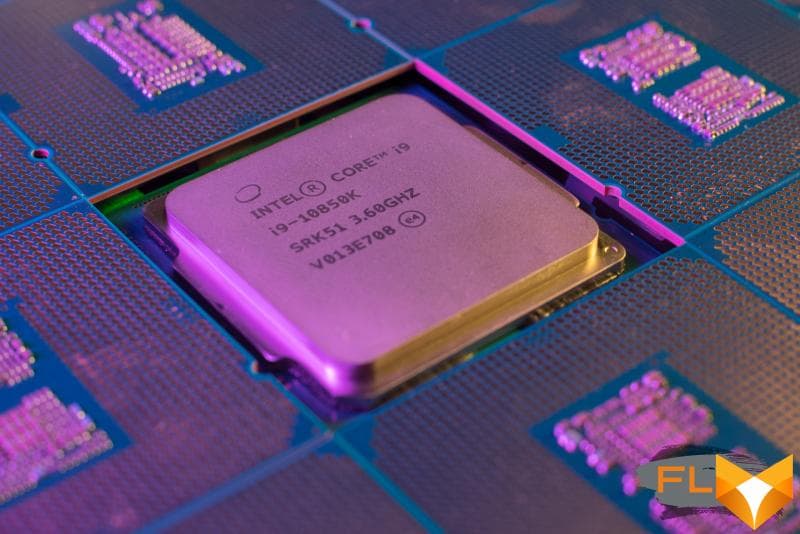
We just need to make sure that buying a Core i9-10850K instead of a Core i9-10900K won’t cause frustration for end users. A fairly common theory is that Intel sends semiconductor crystals with worse silicon quality to weaker processors. And if so, then enthusiasts who want to save money and opt for the Core i9-10850K will face not only slightly reduced performance in the nominal mode, but also weak overclocking potential. And for some, this flaw may turn out to be so serious that the proposed budget savings will no longer compensate for it.
Therefore, we decided to dispel all doubts with practice and conduct detailed testing of the Core i9-10850K. In this article, we will answer two main questions: how much the cheaper ten-core processor is actually slower than the older model in the nominal mode and whether it has any noticeable deterioration in terms of overclocking potential or something else.
⇡#More about Core i9-10850K
It would be strange to expect some revolutionary innovations from the Core i9-10850K. This is another member of the Comet Lake family, all members of which are based on the Skylake microarchitecture and are manufactured using the 14 nm ++ process technology. All its basic properties do not differ from those of the Core i9-10900K and were discussed in detail in the corresponding review. Just like the flagship, the new ten-core processor has free multipliers and supports overclocking, has solder as an internal thermal interface and comes without a complete cooling system.
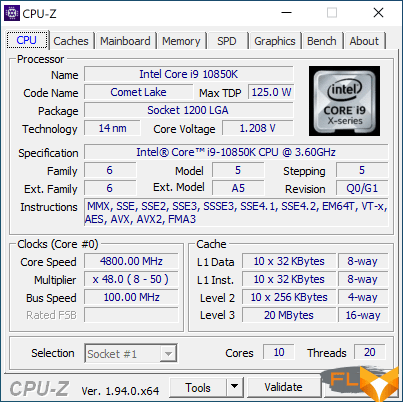
The following table will give more details on what the specification promises for the Core i9-10850K. For clarity, the new product is compared in terms of performance with two other ten-core Comet Lake generations – Core i9-10900K and Core i9-10900.
| Core i9-10900K(F) | Core i9-10850K | Core i9-10900(F) | |
|---|---|---|---|
| Platform | LGA1200 | LGA1200 | LGA1200 |
| Technological process, mm | 14 | 14 | 14 |
| Cores/Threads | 10/20 | 10/20 | 10/20 |
| Frequency (nominal/turbo), GHz | 3,7 | 3,6 | 2.8 |
| Frequency max. turbo 1 core, GHz | 5,3 | 5,2 | 5,2 |
| Frequency max. turbo all cores, GHz | 4,9 | 4,8 | 4,6 |
| L3 cache, MB | 20 | 20 | 20 |
| TDP, W | 125 | 125 | 65 |
| Memory | DDR4-2933 | DDR4-2933 | DDR4-2933 |
| PCIe lanes | 16 ×Gen3 | 16 × Gen3 | 16 × Gen3 |
| Price | $488 | $453 | $439 |
| Price without graphics (F) | $472 | – | $422 |
If we talk about the part of the characteristics that directly affect performance, then there are few differences between the Core i9-10850K and Core i9-10900K. You may have noticed that the new ten-core processor has a 100 MHz lower turbo frequency, but this is mainly due to the fact that it does not have Thermal Velocity Boost technology, which in the flagship processor adds an additional 100 MHz when the chip temperature is below the threshold of 70 degrees. In other words, the Core i9-10900K is faster in nominal mode only if high-quality cooling is used.
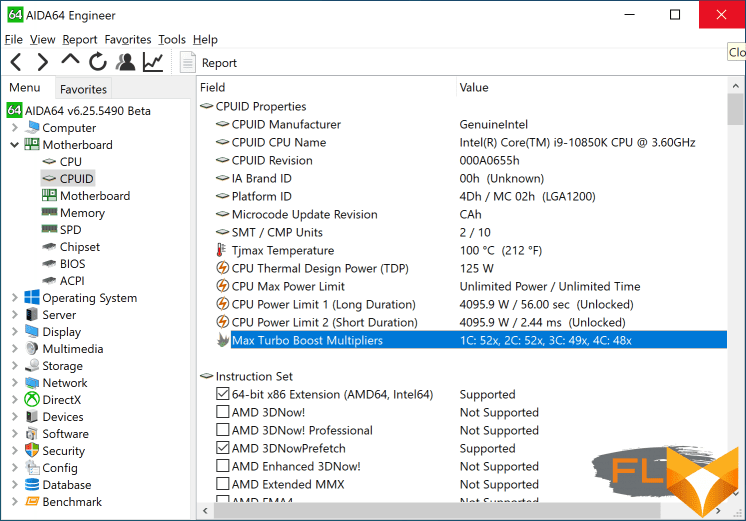
Much more significant is the Core i9-10850K’s lag in base clock speed. According to Intel’s current definition, this frequency sets the point up to which the processor must enter the limits of the thermal package defined for it. And this means that, all other things being equal, the Core i9-10850K can be hotter than the older model, since its heat dissipation can reach 125 W at a lower frequency. However, Intel apparently believes that the $35 savings will make buyers forgive the new product for this feature.
Speaking about the price, it must be pointed out that for the Core i9-10850K there is not yet a cheaper version without a graphics core (-KF), and it is not clear whether it will appear at all. But even without that, the Core i9-10850K invades the price territory of the Core i9-10900. The difference in the price of these processors is only $14, and the new representative in the lineup looks clearly more interesting due to both higher clock speeds and overclocking capabilities. Obviously, for most buyers, the Core i9-10850K will be a more rational purchase, unless we are talking about building an economical or relatively compact system.
However, the acquisition of the Core i9-10850K can plunge the user into additional costs indirectly. Firstly, this processor comes without a cooler, and you won’t get off with a simple cooling system. Secondly, the same PL1 and PL2 consumption limits are set for the Core i9-10850K as for the older processor. Therefore, he is allowed to take up to 250 W from the power system on the motherboard (with loads lasting up to 56 seconds), and even more when the Multi-Core Enhancements feature is enabled. It turns out that for such a processor, as for the Core i9-10900K, you need an advanced motherboard with a solid voltage converter.
Everything said in the previous paragraph can be easily confirmed with one screenshot – the monitoring data of the Core i9-10850K when running in nominal mode in the Cinebench R20 rendering test with the Multi-Core Enhancements functionality enabled (that is, with the consumption limits PL1 and PL2 removed). We tested the processor with a liquid cooling system with a 280mm NZXT Kraken X62 radiator, but this did not prevent the processor from heating up to 80 degrees, which is natural, given its real power consumption of 200W.
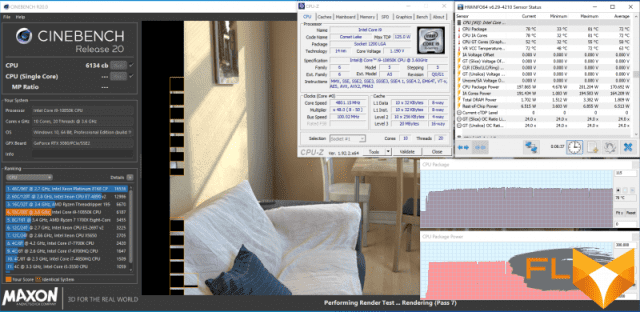
In reality, the Core i9-10850K consumes slightly less electricity and dissipates slightly less heat in normal mode compared to the flagship model. But we are not talking about any fundamental changes: this is also a hot and therefore not the easiest processor to use, like the Core i9-10900K.
⇡#Overclocking
Overclocking limits are one of the most important issues that interest potential buyers of the Core i9-10850K. The fact that Intel can sell exactly the same quality processor as the Core i9-10900K, but cheaper, is hard to believe. It seems much more logical to assume that lower quality semiconductor crystals get into the Core i9-10850K and therefore its overclocking limits will be somewhat narrower.
This assumption is supported by the statistics of the Silicon Lottery store, which pre-sorts processors according to their overclocking potential. According to its experts, the Core i9-10900K and Core i9-10900KF typically reach 5 GHz at 1.17 V, while the Core i9-10850K processors are more often able to provide stability at a frequency of no higher than 4.9 GHz.
However, our experience does not fully overlap with these conclusions. The instance of the Core i9-10850K that came to us overclocked to 5.1 GHz without any problems (with a decrease in frequency by 100 MHz with an AVX load), that is, at least no weaker than the Core i9-10900K. However, to achieve this result, we had to use higher VCORE voltage levels – on this basis, the quality of the Core i9-10850K silicon is really worse. Nevertheless, having an efficient cooling system, you can get quite typical overclocking results for the flagship Comet Lake from the new ten-core processor.
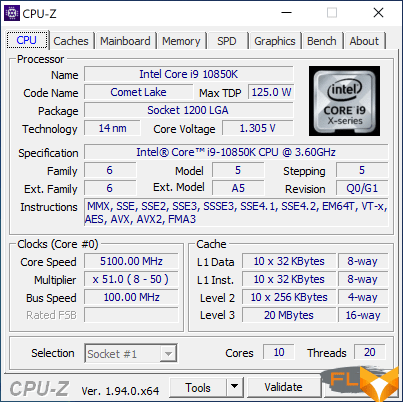
More specifically, we managed to achieve stability from the Core i9-10850K at a frequency of 5.1 GHz under normal load and 5 GHz under AVX load (using the AVX Offset option) by setting the BIOS of the motherboard (ASUS Maximus XII Hero) to V CORE equal to 1.45 V, with the simultaneous transfer of the Load-Line Calibration function to the Level 4 state. Thanks to this approach, the real voltages when the processor is loaded are noticeably lower, and the voltage value depends on the actual power consumption and processor frequency .
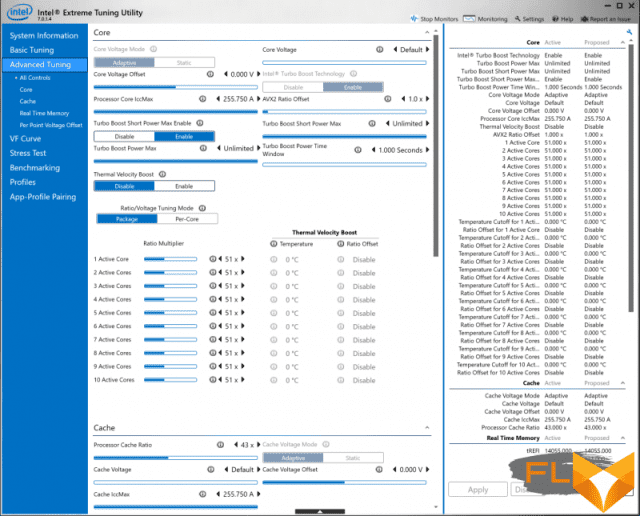
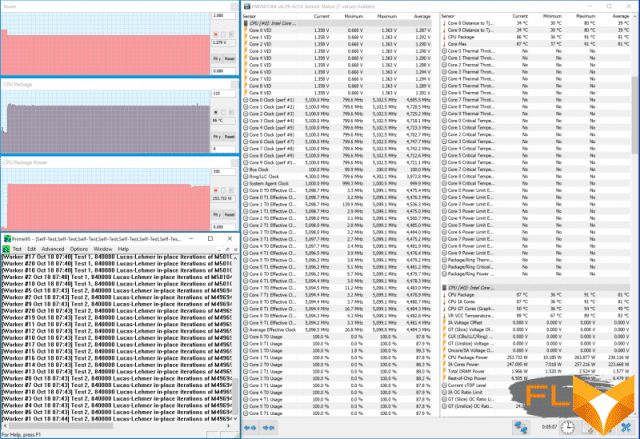
This approach is good because it allows you to get different levels of VCORE at frequencies of 5 and 5.1 GHz. For example, when the processor is running at 5.1 GHz with a load that does not include AVX commands, its real voltage is 1.275 V, power consumption is at 255 W, and heating (using the NZXT Kraken X62 FSS) does not go beyond 90 degrees border.
If the load is changed to one that uses AVX/AVX2 instructions, then the VCORE voltage is reset to 1.225 V, which is enough to maintain stability at a frequency of 5 GHz. But power consumption still rises to 315 W, and the temperature of the processor cores rises to 95 degrees.
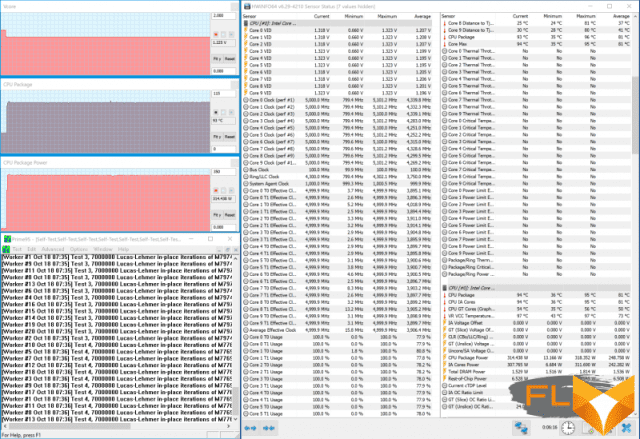
Separately, it is worth mentioning that all the temperature and processor power consumption indicators described above were measured in the Prime95 30.3 stress test, which means that they represent the upper practical limit. In real use, of course, the situation will be simpler, which suggests that the described overclocking of the Core i9-10850K to 5-5.1 GHz is quite possible to use on an ongoing basis.
⇡#Description of the test system and testing methodology
To put the final point in the study of the Core i9-10850K, you need to touch on the issue of its performance. For comparison, we took two of its closest relatives: the flagship Core i9-10900K processor, which costs 7% more, and the non-overclocker Core i9-10900 processor, which is 3% cheaper, but for some reason surpasses the protagonist of this review by model number. In other words, in the tests we will try to understand which of the ten-core Comet Lake on the market is the most interesting in terms of performance and other consumer characteristics.
- Processor:
- Intel Core i9-10900K (Comet Lake, 10 cores + HT, 3.7-5.3GHz, 20MB L3);
- Intel Core i9-10900 (Comet Lake, 10 cores + HT, 2.8-5.2GHz, 20MB L3);
- Intel Core i9-10850K (Comet Lake, 10 cores + HT, 3.6-5.2GHz, 20MB L3).
- CPU cooler: NZXT Kraken X62.
- Motherboard: ASUS ROG Maximus XII Hero (Wi-Fi) (LGA1200, Intel Z490).
- Memory: 2 × 16 GB DDR4-3600 SDRAM, 16-19-19-39 (G.Skill TridentZ Neo F4-3600C16D-16GTZNC).
- Video Card: NVIDIA GeForce RTX 2080 Ti (TU102, 1350/14000MHz, 11GB GDDR6 352-bit).
- Disk subsystem: Samsung 970 EVO Plus 2TB (MZ-V7S2T0BW).
- Power supply: Thermaltake Toughpower DPS G RGB 1000W Titanium (80 Plus Titanium, 1000W).
Since we are talking about top-level systems in this material, all processors worked with the Multi-Core Enhancements function active, that is, with PL1 and PL2 consumption limits turned off. Most motherboards based on the Intel Z490 chipset transfer processors to this state, and this is how real users will most likely operate them. Memory frequency and timings were configured on the test system using the XMP profile.
Testing was performed on the Microsoft Windows 10 Pro (v2004) Build 19041.208 operating system using the following set of drivers:
- Intel Chipset Driver 10.1.18295.8201;
- NVIDIA GeForce 451.67 Driver.
Description of the tools used to measure computing performance:
Comprehensive benchmarks:
- Futuremark PCMark 10 Professional Edition 2.1.2177 – testing in Essentials scenarios (typical work of the average user: launching applications, surfing the Internet, video conferencing), Productivity (office work with a word processor and spreadsheets), Digital Content Creation (creating a digital content: photo editing, non-linear video editing, rendering and visualization of 3D models).
- 3DMark Professional Edition 2.11.6846 – testing in the Time Spy Extreme 1.0 scene.
Applications:
- 7-zip 19.00 – archiving speed testing. The time taken by the archiver to compress a directory with various files with a total volume of 3.1 GB is measured. Uses LZMA2 algorithm and maximum compression ratio.
- Adobe Photoshop 2020 21.2.1 – Graphics performance testing. The average execution time of the Puget Systems Adobe Photoshop CC Benchmark 18.10 test script, which simulates the typical processing of an image taken by a digital camera, is measured.
- Adobe Photoshop Lightroom Classic 9.3 – Performance test for batch processing of a series of RAW images. The test scenario includes post-processing and export to JPEG at a resolution of 1920 × 1080 and a maximum quality of two hundred 16-megapixel RAW images taken with a Fujifilm X-T1 digital camera.
- Adobe Premiere Pro 2020 14.3.1 – Non-linear video editing performance test. This measures the rendering time to YouTube 4K for a project containing HDV 2160p30 footage with various effects applied.
- Blender 2.83.3 – testing the speed of the final rendering in one of the popular free packages for creating three-dimensional graphics. The duration of building the final model pavillon_barcelona_v1.2 from Blender Benchmark is measured.
- Topaz Video Enhance AI v1.3.8 – performance testing in an AI-based program to improve video detail. The test uses the original video at 640×360 resolution, which is scaled up twice using the Theia-Detail model: UE, P.
- V-Ray 4.10.03 – testing the performance of a popular rendering system using the standard V-Ray Benchmark Next application.
- x265 3.2+9 10bpp – testing video transcoding speed in H.265/HEVC format. Performance is measured using a raw 2160p@24FPS AVC video file with a bitrate of approximately 42 Mbps.
Games:
- Assassin’s Creed Odyssey. Resolution 1920 × 1080: Graphics Quality = Ultra High. Resolution 2560 × 1440: Graphics Quality = Ultra High.
- Civilization VI: Gathering Storm. Resolution 1920×1080: DirectX 12, MSAA=4x, Performance Impact=Ultra, Memory Impact=Ultra. Resolution 2560 × 1440: DirectX 12, MSAA = 4x, Performance Impact = Ultra, Memory Impact = Ultra.
- Far Cry 5. 1920 × 1080 resolution: Graphics Quality = Ultra, HD Textures = On, Anti-Aliasing = TAA, Motion Blur = On. Resolution 2560 × 1440: Graphics Quality = Ultra, Anti-Aliasing = Off, Motion Blur = On.
- Hitman 2. 1920 × 1080 resolution: DirectX 12, Super Sampling = 1.0, Level of Detail = Ultra, Anti-Aliasing = FXAA, Texture Quality = High, Texture Filter = Anisotropic 16x, SSAO = On, Shadow Maps = Ultra , Shadow Resolution = High. Resolution 2560 × 1440: DirectX 12, Super Sampling = 1.0, Level of Detail = Ultra, Anti-Aliasing = FXAA, Texture Quality = High, Texture Filter = Anisotropic 16x, SSAO = On, Shadow Maps = Ultra, Shadow Resolution = High.
- Shadow of the Tomb Raider. Resolution 1920×1080: DirectX12, Preset=Highest, Anti-Aliasing=TAA. Resolution 2560 × 1440: DirectX12, Preset = Highest, Anti-Aliasing = Off.
- Total War: Three Kingdoms. Resolution 1920 × 1080: DirectX 12, Quality = Ultra, Unit Size = Extreme. Resolution 2560 × 1440: DirectX 12, Quality = Ultra, Unit Size = Extreme.
- World War Z. 1920 × 1080 resolution: DirectX11, Visual Quality Preset = Ultra. Resolution 2560 × 1440: DirectX11, Visual Quality Preset = Ultra.
In all gaming tests, the results are the average number of frames per second, as well as the 0.01-quantile (first percentile) for FPS values. The use of the 0.01-quantile instead of the minimum FPS is due to the desire to clean up the results from random bursts of performance that were provoked by reasons not directly related to the operation of the main components of the platform.
⇡#Performance in complex tests
Three very similar processors take part in today’s testing, so it’s not surprising that the results of their comparison can be predicted in advance: the differences in benchmarks are unlikely to exceed a few percent. The complex test PCMark 10, which simulates the user’s work in typical scenarios, fully confirms this hypothesis. The Core i9-10850K lags behind its flagship counterpart by about 1.5%, but at the same time it outperforms the Core i9-10900 by 1.3%. Qualitatively, all this can be described by the phrase “almost the same.”


About the same words can be repeated about the results in 3DMark, especially if you look at the overall Time Spy score. At the same time, in the processor subtest, the performance of the Core i9-10850K is closer to the level of the Core i9-10900K, which reflects a 100 MHz gap in the frequencies of the Core i9-10850K and Core i9-10900K over the entire load range, while the 65-watt Core i9 -10900 with a load on all cores lags behind the Core i9-10850K in frequency more – by 200 MHz.


⇡#Performance in Applications
On average, in resource-intensive applications, the Core i9-10850K lags behind its older brother by the expected and inconspicuous 1-2%. And again, it is much closer to the flagship ten-core processor than the processor with a higher model number – Core i9-10900. In other words, in terms of performance, the new Core i9-10850K was placed in a 4 percent gap between the Core i9-10900K and Core i9-10900, but not in the middle, but clearly closer to the flagship.
Rendering:


Photo processing:


Video work:


Video transcoding:


Archiving:

⇡#Performance in games. Tests in 1080p
By this point, it is already very clear what we are dealing with, so the proximity of the bars in the diagrams below is unlikely to come as a surprise to anyone. The frame rate difference between Core i9-10900K and Core i9-10850K-based systems does not exceed half a percent. At the same time, the advantage of the Core i9-10850K over the Core i9-10900 is slightly more noticeable – it is 1.5%. But in the end, all three of these processors provide about the same and exhaustive level of gaming performance in Full HD resolution, for which the power of the CPU is quite noticeable.


⇡#Performance in games. Tests in 2160p
In the case of switching the resolution to 4K, the role of the processor in gaming performance weakens, and the results of the Core i9-10900K, Core i9-10900 and Core i9-10850K converge more closely. Here, perhaps, we can even say that for gaming systems designed for 4K, all three processors are almost equivalent.


⇡#Energy Consumption
Power consumption tests should finally clarify the essence of the Core i9-10850K. From them you can determine how much this processor differs from other ten-core Intel processors in terms of “performance per watt” and whether it makes sense to look towards the Core i9-10850K for those users who care about economy.
The diagrams below show the total consumption of systems without taking into account the monitor and the efficiency of the power supply, measured at the output of the PSU. And the power consumption values shown on them look a little unexpected. The Core i9-10850K was expected to be more economical than the Core i9-10900K, but at the same time it showed approximately the same power consumption as the Core i9-10900, which operates at lower frequencies. From this we can conclude that Intel used silicon with lower leakage currents to create the Core i9-10850K. However, perhaps we just got lucky with a particular CPU instance.
However, in any case, it is very encouraging that the maximum consumption of the Core i9-10850K is lower than that of the Core i9-10900K by as much as 11%, despite the fact that the difference between them in performance does not exceed 1.5%. This means that the Core i9-10850K is much more interesting in terms of energy efficiency and the notorious “performance per watt” ratio. In other words, the new ten-core is, among other things, an energy-optimized version of the flagship.


⇡#Conclusions
Despite the fact that the Core i9-10850K appeared later than the rest of the Comet Lake lineup, was released without much fuss and actually repeated the specifications of the Core i9-10900K with a slight deterioration in clock speed, it turned out to be a very interesting proposal. The secret of attractiveness is in the price: the Core i9-10850K is 7% cheaper than the flagship model without any significant loss in performance and in the frequency potential available through overclocking. And according to some characteristics, it is even better: for example, according to our tests, the Core i9-10850K turned out to be significantly more energy efficient than the older ten-core Comet Lake, which at one time shocked us with its ability to consume up to 300 W in nominal mode.
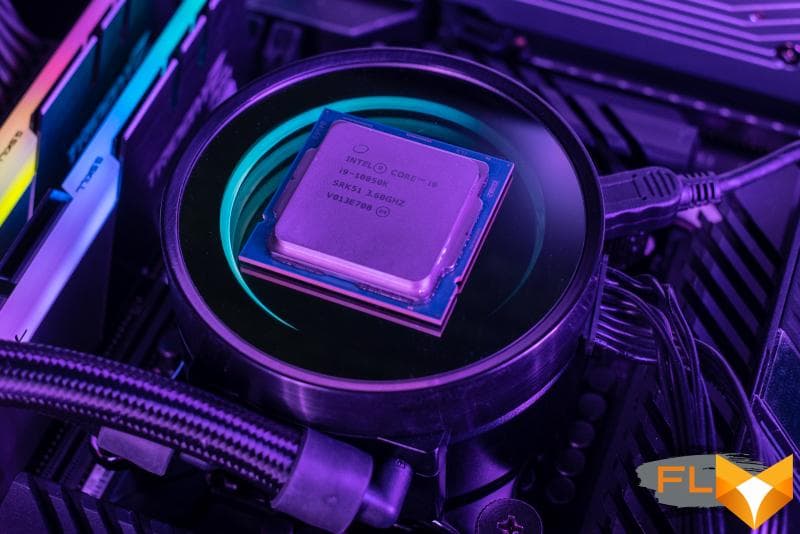
All this means that if you approach the choice of processor rationally, then the combination of factors Core i9-10850K looks more attractive than the Core i9-10900K. If you want to buy a 10-core Intel with a free multiplier, and this is currently the best option for high-end gaming systems, then the Core i9-10850K will be an excellent choice. On the one hand, its lagging behind the flagship is comparable to the measurement error, and on the other hand, it is definitely faster than the non-overclocker Core i9-10900, which is closely approaching in price. The only pity is that the Core i9-10850K does not provide an additional opportunity to save money and does not (yet?) have a cheaper modification without a graphics core. But even without this, its price is still lower compared not only to the Core i9-10900K, but also to the Core i9-10900KF.
Moreover, the replenishment of the Comet Lake lineup allows us to talk about a fundamental reformatting of its upper part. The older Core i9-10900K may well now lose its mass status and move into the category of premium products for uncompromising enthusiasts, like the Core i9-9900KS processor in the past. The role of the flagship processor “for normal people” may well be taken over by the new Core i9-10850K – it is definitely up to it. The main thing is that Intel does not suddenly change its mind and stop supplying it.
